
TOP 10 PIE CHART GENERATORS in 2025: BEST TOOLS and How-To Guide
In the world of data visualization, pie charts remain one of the simplest and most effective ways to represent proportional data. Whether you need to simplify complex numbers for presentations or make your reports more engaging, a powerful pie chart generator can save you tremendous time and effort.
In 2025, the pie chart tools have gotten an upgrade, offering a variety of features to cater to different needs—whether you're a beginner or a seasoned analyst. In this article, we’ll explore the top 10 pie chart generators, provide a how-to guide, highlight common mistakes to avoid, and discuss the future of pie chart creation tools.
In 2025, the pie chart tools have gotten an upgrade, offering a variety of features to cater to different needs—whether you're a beginner or a seasoned analyst. In this article, we’ll explore the top 10 pie chart generators, provide a how-to guide, highlight common mistakes to avoid, and discuss the future of pie chart creation tools.
Why Use a PIE CHART GENERATOR in 2025?
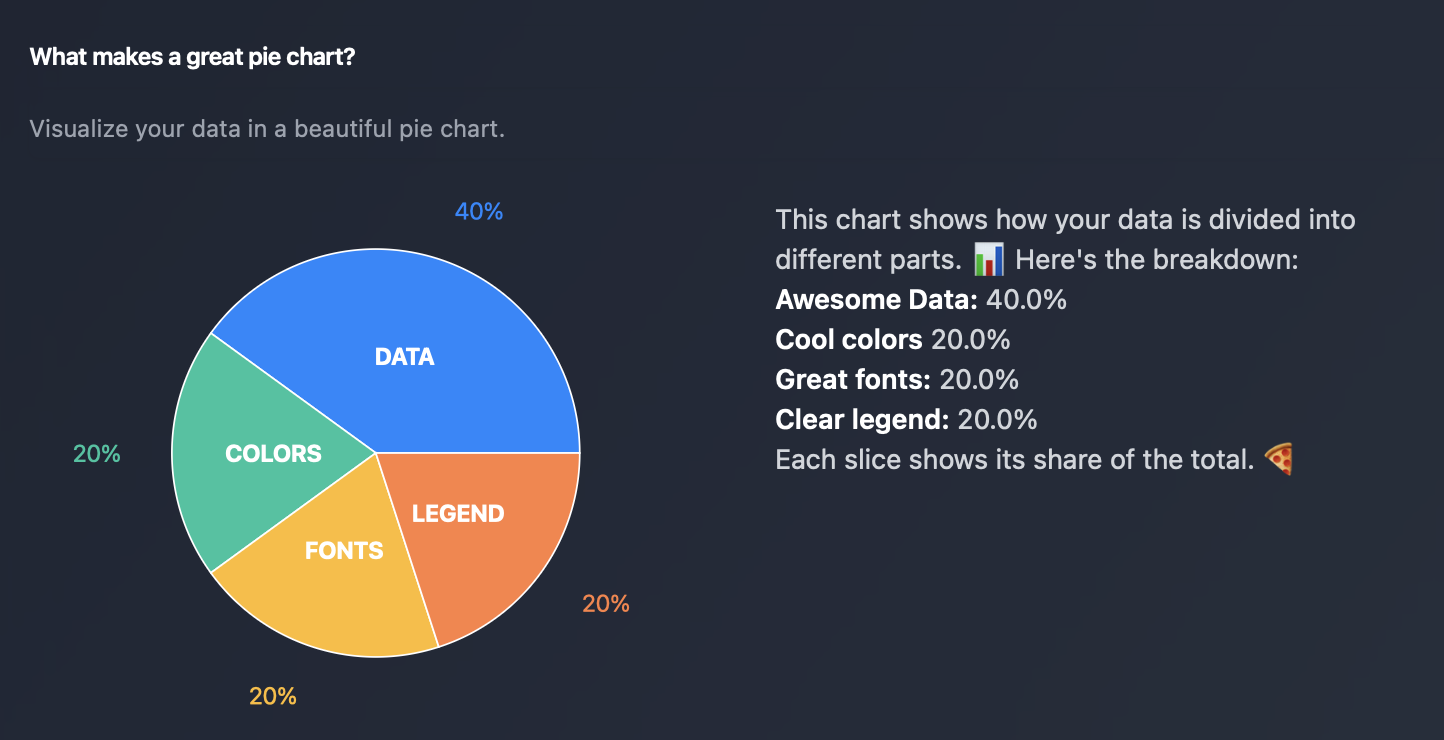
Pie charts are particularly effective at showcasing parts-to-whole relationships, enabling data clarity and easy interpretation. A good chart generator allows you to quickly create customizable, professional-looking visuals without the hassle of manual design. Popular use cases include:
- Business Marketing: Visualize survey results or market segmentation.
- Data Analysis for Presentations: Display financial distribution, sales data, or project priorities.
- Edu-Tech Applications: Help students effortlessly create charts for academic projects.
According to recent statistics, 72% of presenters said pie charts remain one of their top data visualization methods due to their simplicity and power to engage audiences visually. With innovative tools in 2025, creating pie charts has become even easier, faster, and more personalized.
TOP 10 PIE CHART GENERATORS in 2025
1. Canva Pie Chart Maker
Canva Pie Chart Maker is a visual design powerhouse that offers aesthetically pleasing templates, customizable layouts, colors, and fonts to match your branding. Users can easily upload data (e.g., via CSV) and integrate pie charts seamlessly into designs for social media, presentations, or business reports.
Highlight: Perfect for creative professionals, marketing teams, and educators.
2. RapidTables Pie Chart Maker
RapidTables offers a straightforward interface designed for hassle-free pie chart generation. You enter labels and values into a simple table format, and the generator instantly produces a chart. It includes basic customization options like color selection and titles.
Highlight: Great for those who prioritize speed and simplicity.
3. Visme Online Chart Maker
Visme is a versatile data visualization tool tailored to professionals. Its pie chart generator enables high customization, allowing users to import data, adjust appearance, and even integrate charts into broader infographic designs.
Highlight: Ideal for users creating advanced reports or interactive visuals.
4. ChartGo
ChartGo provides an easy-to-use and free online tool for pie chart creation. You only need to input your data using a table format, customize the colors or layout, and download the chart instantly.
Highlight: Perfect for casual users who don’t need advanced features or registration.
5. Google Charts
Google Charts is a developer-friendly, free data visualization tool that allows users to create fully customizable pie charts using JavaScript. Although it requires technical expertise, the flexibility it offers is unbeatable for advanced users looking to integrate charts into web applications or data dashboards.
Highlight: Best for coders and developers who need robust customization.
6. Displayr Pie Chart Maker
Displayr combines statistical precision with visual tools to create pie charts that prioritize accuracy. It supports features like exploded slices, annotated charts, and strategic ordering of data sets for clarity.
Highlight: Suitable for statisticians or analysts creating charts for academic or corporate projects.
7. Infogram Pie Chart Maker
Infogram goes beyond static visuals, offering interactive pie chart designs that can be embedded into websites or shared via social media. Users can integrate data directly from Excel or Google Sheets and customize the design heavily.
Highlight: Tailored for users aiming to create engaging visual content for businesses or blogs.
8. Chartify by Spotify Design
Chartify is a powerful Python library designed to assist with programmatic chart creation, including pie charts. It’s geared towards developers seeking to automate layouts and customize features through Python coding.
Highlight: A dream tool for tech-savvy users who want coding flexibility.
9. Online Chart Tool
Online Chart Tool allows users to create pie charts quickly by entering data, choosing colors, and downloading the chart directly as an image file. Its interface is simple, making it accessible for everyday use.
Highlight: Great for quick chart creation without registration.
10. Piktochart Pie Chart Generator
Piktochart specializes in visually stunning, customizable charts and infographics. Its pie chart maker lets users add animations, select from professional themes, and export high-quality visuals for professional presentations.
Highlight: Tailored for content creators and professionals who want standout visual materials.
How to Create a Pie Chart: Step-by-Step
- Pick a Tool: Decide on an appropriate generator based on use case, such as Canva for creative designs or RapidTables for quick outputs.
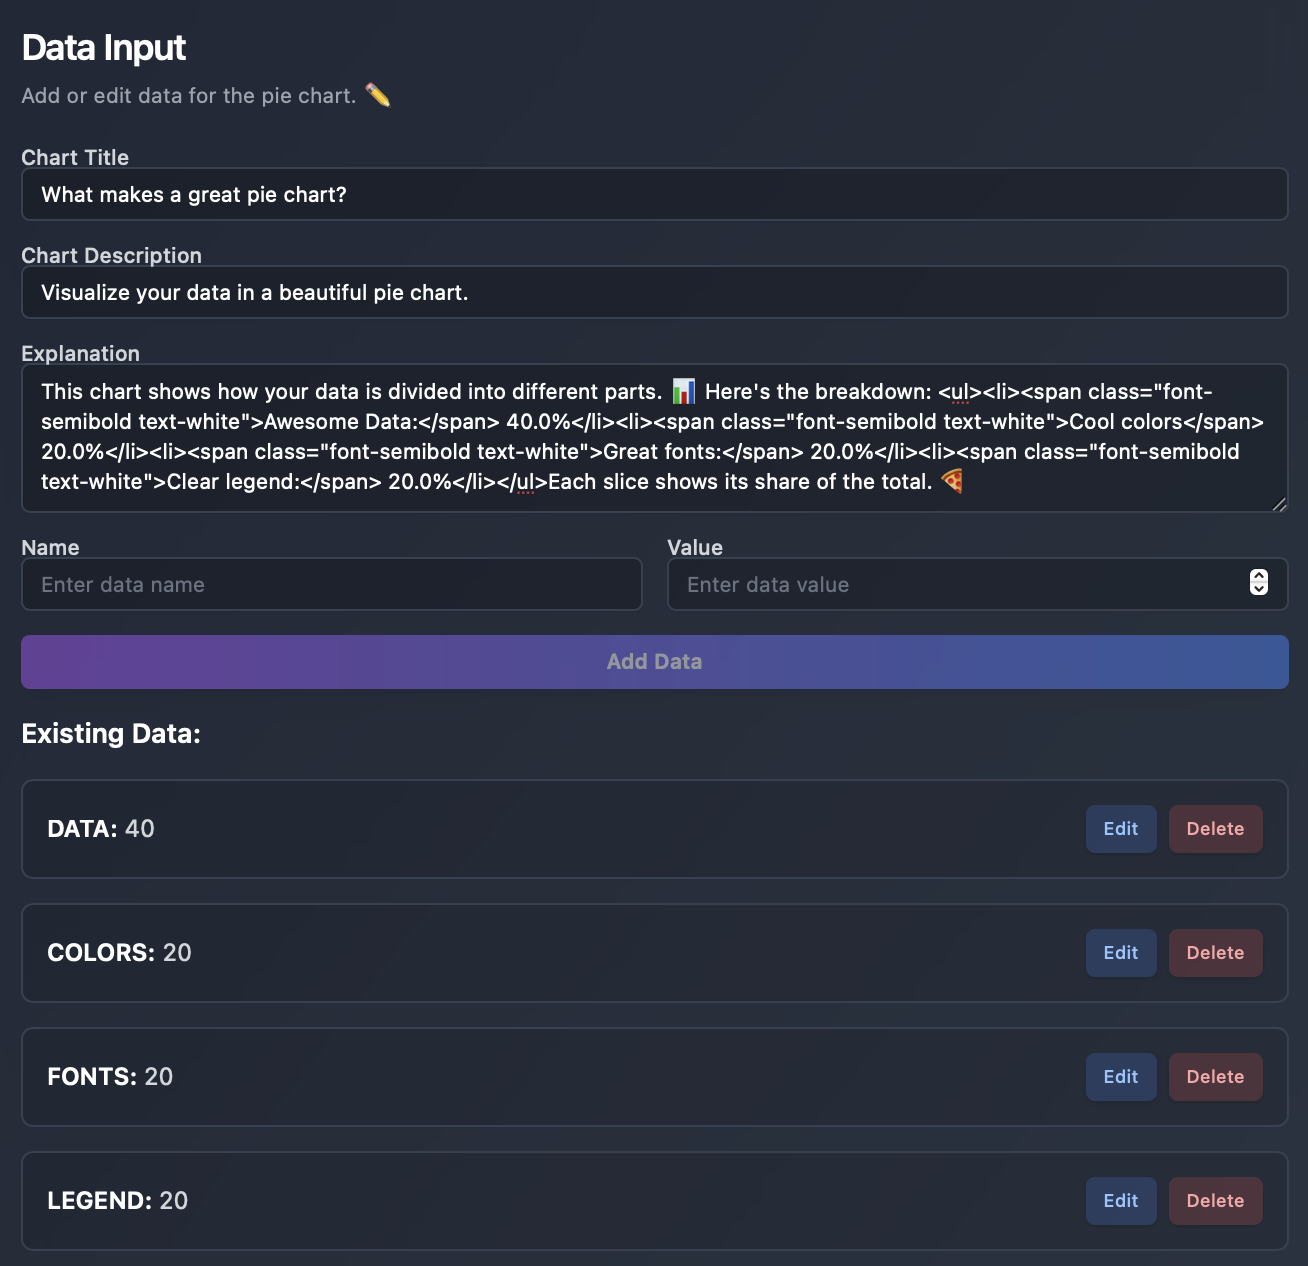
- Input Data: Enter your data manually or upload a file (e.g., CSV) depending on the platform.
- Customize Appearance: Adjust colors, fonts, labels, and titles to match your brand or project requirements.
- Preview Chart: Check for errors and verify data accuracy before finalizing.
- Download or Publish: Save your chart in formats such as PNG, SVG, or PDF, or share it via social/online platforms if supported.
Common Mistakes to Avoid
- Cluttered Charts: Avoid using too many slices in your pie chart to ensure legibility.
- Inaccurate Data Proportions: Verify your data input values to prevent misleading visuals.
- Ignoring Context: Ensure your pie chart fits the narrative you’re presenting. Avoid pie charts if the data doesn’t represent proportions well (consider bar charts or line graphs for trends).
- Overdoing Customization: While aesthetics are important, readability should take precedence over excessive design.
The Future of Pie Chart Generators
In 2025, pie chart tools have evolved to include features like interactive elements, AI-driven insights for chart optimization, and seamless integration into presentations and web dashboards. As businesses and educators demand more from their data tools, pie chart generators will continue to advance in customization options, ease of use, and incorporation of smart analytics.
Conclusion
The top 10 pie chart generators in 2025 provide options for every user—from casual project creators to data analysts and web developers. Whether you prioritize speed (such as with RapidTables) or need high-end customization (Visme comes to mind), there’s a tool out there for your needs.
By following the step-by-step guide and avoiding common pitfalls, you can create impactful pie charts that make data not just digestible, but memorable. Explore tools like Canva Pie Chart Maker or Infogram today to upgrade your data presentations to the next level!
FAQ
1. What are the top pie chart generators to use in 2025?
In 2025, some of the best pie chart generators include Canva, RapidTables, Visme, and Infogram, each offering unique features for various needs. Check out Canva Pie Chart Maker | Discover RapidTables | Explore Infogram.
2. Why should I use a pie chart generator?
Pie chart generators simplify the creation of visually appealing, professional-looking charts, making it easier to represent data proportions. Learn more about using pie charts.
3. Are there any free pie chart generators available online?
Yes, tools like RapidTables, ChartGo, and Google Charts are free and user-friendly options for generating pie charts. Check out ChartGo | Explore Google Charts.
4. Can I customize the appearance of my pie charts?
Most pie chart generators allow for extensive customization, including colors, fonts, and data labels, giving you the flexibility to match your brand's style. Discover customization options at Visme.
5. Is there a pie chart generator specifically for advanced users?
Google Charts is a great option for more advanced users as it offers customizable features via JavaScript, ideal for developers. Learn more about Google Charts.
6. What common mistakes should I avoid when creating pie charts?
Avoid cluttered charts, inaccurate data proportions, and overdoing customization to ensure data clarity and readability. Check out common mistakes to avoid.
7. Can I use AI to write SEO-optimized articles that help my brand grow?
Most business owners don't understand how SEO works, let alone how to use AI for writing blog articles. That's why for busy business owners there's a great free tool that doesn't require much knowledge. Write articles for free.
8. What is the best pie chart generator for educational purposes?
Tools like Canva and Infogram are excellent for students, allowing easy creation of charts for academic projects with engaging visuals. Explore Canva Pie Chart Maker | Discover Infogram.
9. Are there any pie chart generators that support social media integration?
Yes, Canva and Infogram both offer options to easily export and share pie charts on social media platforms. Check out Canva | Explore Infogram.
10. How can I ensure my pie charts convey the right message?
Make sure your pie chart is clear and not cluttered, accurately represents data proportions, and matches the context of the information being presented. Learn more about creating effective pie charts.